

Part of a Geographic Travels series examining how governments and institutions map geographic vulnerability, and what those maps reveal, emphasize or leave out.
Editor’s note: This article was originally published on Geographic Travels in July 2010. It has been independently rewritten, expanded and fact-checked in 2026 while preserving the original article’s focus on maps of geographic vulnerability.
In this series, we use “vulnerable geography” to describe maps that visualize how terrain, distance, borders, population or infrastructure shape perceptions of security. It is not a formal academic term with a fixed scholarly definition; it is an editorial lens Geographic Travels uses to read this kind of cartography.
During the Cuban Missile Crisis, U.S. officials used maps showing how far Soviet missiles based in Cuba could reach. Missile-range maps preserved by the John F. Kennedy Presidential Library show how distance could turn an abstract strategic threat into something immediately visible: one Defense Department briefing board plotted the 1,100 and 2,200 nautical mile ranges of Soviet medium- and intermediate-range missiles, showing large parts of the United States falling within reach of a base ninety miles from Florida. Maps like these are a useful introduction to what Geographic Travels calls vulnerable geography.
Maps of geographic vulnerability are necessarily selective. They may show missile range, elevation, roads, population centers or territorial boundaries while leaving other variables outside the frame. That does not make a map inaccurate, but it does mean readers should distinguish between what the map measures and what argument its publisher draws from it.
Israel provides a useful case study because both official agencies and nongovernmental policy organizations have published maps emphasizing different dimensions of the country’s geographic security concerns. So do organizations documenting the situation on the other side of that same geography. Below are several of those maps and the arguments built on top of them.
The Home Front Command Maps
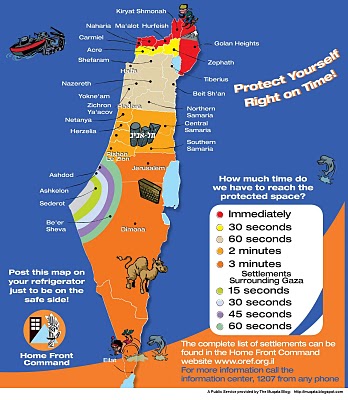
The original 2010 Geographic Travels article featured a map from Israel’s Home Front Command (Pikud HaOref) showing how many seconds residents in different areas have to reach shelter after a rocket or missile launch is detected. Israel’s warning system divides locations according to the time available to reach protected space, though the zones and timings have changed as alert systems and threats have evolved. During the 2014 Gaza conflict, communities near the Gaza border generally had around 15 seconds to take cover, compared with roughly 90 seconds for residents of Tel Aviv and Jerusalem, a range documented across multiple contemporaneous and retrospective accounts of that period’s alert system. Warning windows have shifted since, including brief periods of far shorter notice during direct missile exchanges with Iran in 2025. For anyone in Israel today, the operative source is current Home Front Command guidance, not a historical snapshot.
Their stated purpose is civil defense. In the context of this article, however, they also illustrate how strongly warning time is affected by geographic distance from likely launch areas.
Historical warning-time map. Alert zones and protection times change; consult current Home Front Command guidance for emergency information.
The “Defensible Borders” Argument
The strategic idea usually described as “defensible borders” predates the institutional campaign most associated with it today. One influential early expression was Yigal Allon’s proposal after the 1967 Six-Day War for Israeli control of a security strip roughly 10 to 15 kilometers wide along the Jordan Valley and the Dead Sea, intended to give Israel a defensible eastern frontier while returning the more densely populated central West Bank to Jordanian administration. The plan was never officially adopted, but it shaped Labor government settlement policy in the Jordan Valley for a decade afterward.
Decades later, the Jerusalem Center for Public Affairs, renamed the Jerusalem Center for Security and Foreign Affairs (JCFA) in 2024, became one of the most prominent institutional advocates of this approach through its long-running Defensible Borders initiative. The argument rests on measurable physical facts: under the 1949 Armistice Lines, often called the Green Line, Israel narrowed at its central section to roughly 15 kilometers, about nine miles, between that line and the Mediterranean. JCFA material argues that roughly 70% of Israel’s population and 80% of its industry remain concentrated in the coastal cities adjacent to that narrow corridor, though that specific figure is JCFA’s own estimate rather than an independently audited statistic.
The Jordan Rift is dramatically lower than the central mountain ridge to its west. Parts of the rift, including the Dead Sea, sit roughly 430 metres below sea level, while sections of the central ridge running through the West Bank rise to roughly 900 to 1,000 metres above sea level. Defensible-borders advocates argue that this combination of elevation, distance and terrain would let Israeli forces defend an eastern approach with greater warning time and fewer disadvantages than positions farther west; that conclusion is a strategic interpretation of the terrain, not a feature of the terrain itself.
The importance assigned to the Jordan Valley was not limited to later think-tank publications. In his October 5, 1995 address to the Knesset on the Israeli-Palestinian Interim Agreement, a month before his assassination, Prime Minister Yitzhak Rabin said Israel’s “security border” would be located “in the Jordan Valley, in the broadest meaning of that term.” The debate has intensified again since the October 7, 2023 attacks. Some Israeli security analysts have renewed arguments for long-term control of strategic terrain, while others argue that military security requirements need not determine permanent territorial sovereignty.
The Map From the Other Side
What the 2010 version of this article did not show is that Israeli and Palestinian organizations produce an equally direct form of vulnerable geography, aimed at demonstrating the opposite pressure: not the risk of losing strategic terrain, but the reality of already having lost access to it. Under the 1995 Oslo II agreement, the West Bank was divided into Areas A, B and C, each with different interim arrangements for Palestinian and Israeli civil and security authority. Later maps from the Israeli human rights organization B’Tselem and UN OCHA overlay those administrative divisions with settlements, the separation barrier and movement restrictions.
These maps focus on a different kind of geographic vulnerability: the distribution of administrative control, settlements, barriers and restrictions on movement. In a survey conducted in December 2025, OCHA documented 925 permanent or intermittent movement obstacles across the West Bank, including East Jerusalem, restricting the movement of an estimated 3.4 million Palestinians, a figure OCHA describes as 43% above the twenty-year annual average.
Security arguments about terrain should also be kept separate from questions of legal status. In its July 19, 2024 advisory opinion, the International Court of Justice found Israel’s continued presence in the Palestinian territories occupied since 1967 unlawful, including its settlement activity. Advisory opinions of this kind are not automatically binding in the way a contentious-case judgment is, but they are widely treated by UN bodies and much of the international legal community as authoritative statements of the law. Israel rejects central elements of that legal characterization and maintains that the Oslo framework, not the ICJ opinion, remains the operative basis for allocating authority pending a negotiated settlement.
What This Series Is Actually About
The point of collecting vulnerable geography maps is not to decide which side’s cartography is more correct. The more useful questions are specific ones: who produced the map, and when. What does its legend actually measure. What territorial or legal assumptions does it build in. And what relevant information sits outside the frame.
Such maps can do two things at once: describe measurable geographic conditions and support a broader interpretation of what those conditions mean. Reading them well means asking what the map is measuring and what it is arguing, and treating those as two different questions.
Future entries in this series will look at how other contested regions, from the Korean Peninsula to the Taiwan Strait, produce their own versions of the same kind of map, and what physical terrain has to do with each one.
