

Florida ranks first among the contiguous U.S. states when flatness is measured by the combined percentage of terrain classified as “flat,” “flatter,” or “flattest” in a 2014 geographical study. Illinois and North Dakota follow. The research covered the 48 contiguous states and Washington, D.C., not Alaska or Hawaii.
That qualification matters. A ranking based on nearby terrain is not the same as a list of states with the lowest average elevation or the smallest difference between their highest and lowest points. The results below follow one measure from Jerome E. Dobson and Joshua S. Campbell’s original terrain-flatness study, rather than mixing those approaches.
Flattest States in the US at a Glance
| Rank | State | Analyzed area classified “flat,” “flatter,” or “flattest” |
|---|---|---|
| 1 | Florida | 52% |
| 2 | Illinois | 50% |
| 3 | North Dakota | 49% |
| 4 | Louisiana | 47% |
| 5 | Minnesota | 47% |
| 6 | Delaware | 44% |
| 7 | Kansas | 44% |
| 8 | Texas | 43% |
| 9 | Nevada | 43% |
| 10 | Indiana | 42% |
Source and scope: Table 1 of Dobson and Campbell’s 2014 study, available in the authors’ prepublication manuscript. These are the published combined percentages, not percentages in the strictest category alone. Large lakes and reservoirs were masked from the analysis. Alaska and Hawaii were not included. D.C. appears in the full source table but is not a state and does not affect these top-ten positions.
Percentages are rounded to whole numbers. Where displayed values match, the table retains the source’s ordering without inventing decimal values or a new tie-breaker. Geological qualifications appear in the state descriptions below.
How This Flatness Ranking Was Measured
The researchers analyzed an elevation grid with approximately 90-meter cells from the Shuttle Radar Topography Mission, which collected its radar observations in 2000. Their model assessed how much higher terrain interrupted the surrounding horizon, rather than simply measuring elevation above sea level.
From each cell, they examined 16 directions out to 5,310 meters, about 3.3 miles. A direction qualified as flat when its upward horizon angle was below 0.32 degrees. The categories depended on the number of qualifying directions: 0–4 meant “not flat”; 5–8, “flat”; 9–12, “flatter”; and 13–16, “flattest.” This article ranks states by the area percentage in the last three categories combined.
The methodology also specifies a mask removing large lakes and reservoirs. Its focus on higher surrounding terrain means that depressions below the observer are not assessed in the same way as hills above them.
This is therefore a particular model of terrain flatness, not a universal test of smooth ground. Its distance, angle threshold and category boundaries affect the result. A qualifying location need not have a low horizon in every direction, and a statewide percentage cannot describe every individual landscape.
The 10 Flattest States and Their Landscapes
1. Florida: Low-Lying Terrain, Not a Perfectly Level Surface
Florida’s leading position is consistent with extensive low-relief landscapes, but the geological explanation is more useful than the idea that it has no hills.
In southern Florida, the National Park Service’s account of Big Cypress describes a low-lying platform underlain by roughly horizontal, carbonate-rich layers. Repeated changes in sea level have submerged and exposed this landscape. These are important ingredients in understanding its broad, gently varying surface.
There are local irregularities even here. Acidic water dissolves carbonate rock, producing solution holes and other karst features. Farther north, the Everglades geology overview contrasts southern Florida’s solution holes with the sinkholes found in central and northern Florida.
Low elevation and low local relief coincide across important parts of Florida, but they remain separate observations. Its first-place result describes the proportion of terrain meeting the study’s criteria, not the absence of rises, hollows or regional differences.
2. Illinois: A Landscape Built as Well as Eroded by Ice
Illinois illustrates why “glaciers flattened everything” is an incomplete explanation. Ice removed material in some places while depositing sediment in others. Meltwater and later streams added further changes.
The Illinois State Geological Survey’s map of surface deposits and landscapes describes glacial erosion of former hills and sediment filling valleys in the till plains of east-central Illinois. Till is the mixed sediment deposited directly by ice. Meltwater also spread sand and gravel, called outwash, while sediment accumulated in former lakes. Chicago occupies part of a former lake bed.
Glacial deposits did not produce a uniformly smooth surface. Moraines form ridges, and streams have dissected older plains. Southern Illinois also includes unglaciated terrain with cliffs and steep valleys.
3. North Dakota: The Red River Valley and a Much Rougher West
The exceptionally level Red River Valley is central to understanding North Dakota’s reputation. The North Dakota Geological Survey identifies it as the sediment-covered floor of Glacial Lake Agassiz. Its low-relief surface is a former lake plain, not simply a broad valley carved to its present shape by the modern river.
North Dakota and Minnesota are neighboring U.S. states that border Canada, and the Red River region provides a physical-geography connection between them.
The same geological survey distinguishes the Red River Valley from rolling glaciated plains, the hummocky Missouri Coteau and the rugged Little Missouri Badlands. Those western landscapes are important exceptions to any statewide shorthand.
4. Louisiana: River Deposits, Coastal Plains and Upland Exceptions
Louisiana’s placement is understandable in the context of its alluvial and coastal landscapes. Alluvium is sediment deposited by flowing water, and repeated deposition can build broad plains while preserving smaller variations within them.
The Louisiana Geological Survey’s Plaquemine quadrangle study documents Mississippi River floodplain deposits alongside older uplands. Its mapped features include natural levees, backswamps and former river channels. Even a low-relief floodplain is therefore not an entirely level sheet.
Nearby, the survey’s French Settlement geological account describes older coastal-plain deposits, stream valleys and swamp deposits at the edge of the Mississippi delta plain. Together, these examples show both sediment-built lowlands and terrain that lies above them.
The flatness ranking is not a flood-risk assessment, and it does not establish whether a particular Louisiana location is above or below sea level.
5. Minnesota: Former Lake Plains Within a Varied Glacial Landscape
Minnesota shares the Lake Agassiz story with North Dakota. The Minnesota Geological Survey’s glacial history places that former lake in the Red River lowland of northwestern Minnesota and describes other lakes that formed along retreating ice margins.
However, ice also left moraines, rolling hills and irregular deposits. Glacial meltwater carved the large valley now occupied by the Minnesota River. Deposition and erosion worked together, producing contrasts rather than one uniform land surface.
Minnesota’s many present-day lakes do not, by themselves, explain its ranking. A lake count is not a terrain measurement, and the flatness study removed large lakes and reservoirs before calculating its area results. The relevant distinction is between a former lake floor now exposed as land and an existing water surface excluded by the mask.
6. Delaware: Coastal Plain With a Piedmont Corner
Most of Delaware lies in the Atlantic Coastal Plain, while northern New Castle County contains Piedmont hills. The Delaware Geological Survey’s geological history explains that the Coastal Plain is built from sediments transported from the Piedmont and adjacent Appalachian Mountains.
That contrast helps explain how a small state can contain extensive gently varying terrain without being uniformly flat. The northern hills are a distinct setting, with older metamorphic rocks and a different erosional history.
7. Kansas: Why It Is Not First
Kansas is seventh under this measure, not first. Its landscapes include broad plains, but the state also contains substantial regional contrasts.
The Kansas Geological Survey’s overview of its physical regions describes the High Plains as expanses of flatland and gently rolling hills underlain by sediment carried from the Rocky Mountains. It also identifies the Flint Hills, Smoky Hills, dissected landscapes and other regions that do not match a uniformly level stereotype.
Kansas gains elevation gradually from east to west. A long, gentle rise can create a considerable statewide height difference without producing steep local ground. This is why elevation range and nearby terrain flatness can give different impressions of the same state.
The famous pancake comparison answers another question entirely. In 2003, researchers compared a pancake’s surface profile with a transect across Kansas. The original publisher’s account of that research describes the comparison. It was not a competition between states, so it cannot establish Kansas as the country’s flattest.
8. Texas: Extensive Plains Do Not Describe the Whole State
Texas brings two distinctions into focus: regional diversity, and the difference between a proportion and a total area.
The University of Texas Bureau of Economic Geology’s Physiographic Map of Texas identifies the nearly flat High Plains, low-relief Coastal Prairies and contrasting plateaus, canyons and western mountain ranges. Its accompanying text explains that stream-deposited sand and gravel underlie the High Plains, while rivers have cut into their margins.
A landscape can therefore be broadly level across a plateau yet sharply dissected near an escarpment or canyon. Texas’s mountain regions do not disappear because other parts meet a local-flatness criterion.
Nor does a lower percentage necessarily mean less flat land in square miles. A percentage describes the share of an analyzed area; an absolute total depends on its size as well. This ranking compares shares, not the number of square miles qualifying in each state.
9. Nevada: How Mountains and Flat Basin Floors Coexist
Nevada is the clearest reason to read the metric before interpreting the ranking. Its ninth-place position does not mean it has few mountains.
The National Park Service explains how Basin and Range terrain developed: crustal stretching and faulting produced alternating mountain blocks and basins. Material eroded from the mountains accumulated in the basins, including across valley floors.
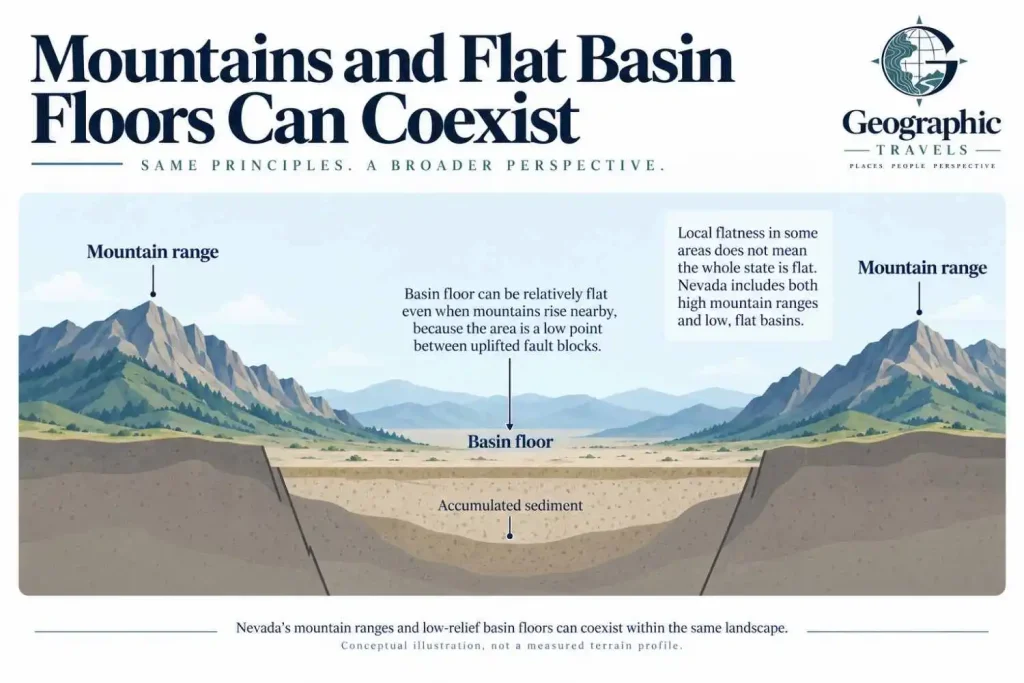
That combination helps explain how substantial areas can satisfy a local-flatness criterion while mountains remain a dominant part of the wider landscape. Under this study’s combined measure, a location does not need to qualify in all 16 directions.
The category breakdown is revealing. Nevada has 43% in the three categories combined but only 1% in the strictest “flattest” category. Its rank in that strictest category is 38th, rather than ninth, in the source table.
These are different summaries of the same analysis, not contradictory observations. Nevada’s example also cautions against translating “a substantial percentage qualifies” into “the state is uniformly low-relief.”
10. Indiana: Till Plains Interrupted by Ridges and Valleys
Indiana’s glacial deposits provide another example of relatively level land over a more complicated underlying landscape.
An Indiana Department of Natural Resources study of the Lafayette, or Teays, bedrock valley describes the Tipton Till Plain as flat to slightly rolling, with moraine ridges and valleys cut by modern streams. Glacial sediment filled an older, irregular bedrock landscape, changing the surface above it.
The report contrasts that buried terrain with the exposed bedrock and deep, narrow valleys found in parts of south-central Indiana. Even within the till plain, river valleys interrupt the smoother surface.
Why Flatness Rankings Can Differ
Different measurements answer different questions. Before comparing two lists, check their definitions, geographic coverage and data sources.
| Measurement | What it describes | What it does not establish |
|---|---|---|
| Local terrain flatness | How little terrain rises or falls nearby, under a defined method and distance | A universal result independent of scale or thresholds |
| Percentage classified as flat | The share of analyzed area meeting specified criteria | The total square miles of qualifying terrain |
| Absolute flat area | Qualifying terrain measured in square miles or square kilometers | The proportion of the state that qualifies |
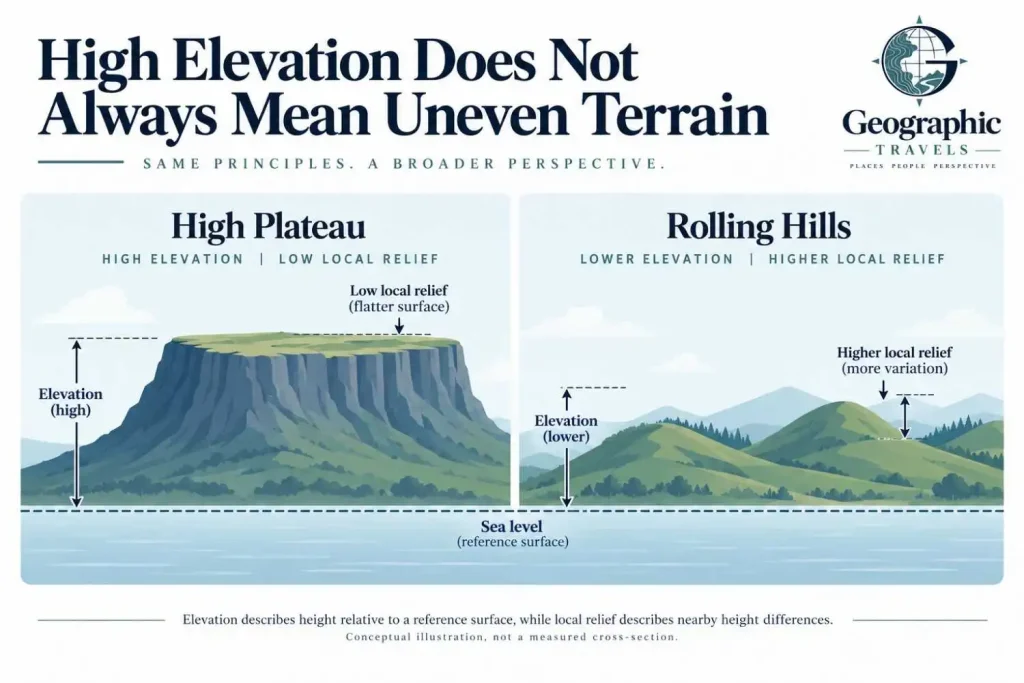
| Mean elevation | Average height relative to an elevation reference surface | Whether nearby ground is level or steep |
| Statewide elevation range | Highest elevation minus lowest elevation | How the intervening terrain is arranged |
| Local relief and slope | Height variation within an area, and steepness over a distance | One interchangeable statewide flatness score |
The Illinois State Geological Survey distinguishes relief from slope: a broad height difference and a steep incline are not the same thing. Imagine a high plateau with little local variation and a low coastal area interrupted by closely spaced hills. “Higher” need not mean “less flat.”
Even the original flatness study presents different summaries. Its numbered state-ranking map uses the strictest category, whereas the main table above uses the combined categories. A map and a table can therefore disagree in rank without either being incorrectly copied, provided their labels identify the difference.
Spatial scale matters too. A short measurement window and a wider horizon can capture different features. Coauthor Joshua Campbell’s discussion of possible methodological improvements considers multiple scales and improved elevation data. Modern sources such as the USGS 3D Elevation Program do not automatically update the 2014 ranking; producing a replacement would require a new, documented analysis.
What Makes These Landscapes Flat?
There is no single process behind all ten states. The distinction between erosion, which removes material, and deposition, which adds it, is particularly important.
Ice and meltwater can both reduce and create relief. Glaciers may erode high ground and deposit sediment in low areas, while also building moraine ridges. Water ponded beside ice can leave sediment-covered lake floors. The Illinois geological map shows why a till plain, an outwash deposit and a former lake plain should not be treated as identical landforms.
Rivers and coastal processes can build broad depositional surfaces. Louisiana’s floodplains and coastal terraces demonstrate this process, but channels, natural levees and older uplands retain local differences. Sediment accumulation does not produce a mathematically horizontal surface.
A plain can also have a regional gradient. The High Plains show why gradual elevation change across a long distance is compatible with relatively level surroundings. In Nevada, meanwhile, sediment accumulating between mountain ranges can create low-relief basin floors without removing the neighboring mountains.
The same caution applies to how glaciation shaped Canada’s lake landscapes. Ice can leave depressions and ridges as well as plains. Glaciation is a history of landscape change, not a guarantee that the resulting ground will be flat.
The Bottom Line
Florida leads this comparison because the largest percentage of its analyzed area falls within the study’s three qualifying flatness categories. The more useful lesson is how to read the result: identify the metric, check which places were included, and distinguish a statewide summary from local terrain. Kansas’s gradual rise and Nevada’s mountains are not exceptions to that logic; they show why it matters.
Frequently Asked Questions
Florida ranks first in the 2014 study when the combined percentage in the “flat,” “flatter” and “flattest” categories is used. The study examined the contiguous states and D.C.; it did not establish a ranking that also includes Alaska and Hawaii.
Under the combined-percentage measure used here, the first five are Florida, Illinois, North Dakota, Louisiana and Minnesota. That order belongs to this particular terrain model. A list based on statewide elevation range or the strictest category alone answers a different question.
No. Its geographic coverage is the 48 contiguous states plus Washington, D.C., which is a federal district rather than a state. Alaska and Hawaii were not analyzed. Their absence should be labeled “not included,” never interpreted as zero flat land.
The flatness ranking does not answer that question. Mean elevation describes average height, while this study classifies surrounding terrain. Establishing which state has the lowest average elevation requires a separate, consistently sourced comparison rather than an inference from these results.
The researchers used a water mask to remove large lakes and reservoirs. That is more precise than claiming that every water surface was excluded. Former lake beds now exposed as land, such as parts of the Lake Agassiz plain, are a different case.
No. A state-level percentage does not describe a particular route, and this model emphasizes surrounding higher terrain rather than every small rise or depression. Assessing a road or trail requires local information about its actual elevation profile and surface conditions.